

Inventory Velocity Intelligence: How AI Accelerates Stock Turn Without Stockouts
Fifteen per cent of your working capital sits in stock that hasn't moved in six months. AI transforms this from reactive clearance to proactive velocity management, predicting turn rate decline 60 - 90 days before it shows up in traditional reports.
Inventory Velocity Intelligence: How AI Accelerates Stock Turn Without Stockouts
Fifteen per cent of your working capital sits in stock that hasn't moved in six months. For a £50m distributor, that's £7.5m tied up in inventory that generates no return whilst consuming warehouse space and management attention.
Most B2B distributors carry 15 - 25% dead or slow-moving stock without realising it until quarterly reviews reveal the damage. By then, the cash is locked up, storage costs have accumulated, and the only option is aggressive markdowns that destroy margin.
AI changes this from reactive clearance to proactive velocity management. Instead of discovering slow-moving stock after the fact, intelligent systems predict velocity decline 60 - 90 days before it shows up in traditional reports. This shift from stock management to cash flow optimisation transforms how distributors think about inventory investment.
Beyond Traditional ABC Analysis: AI-Driven Inventory Velocity
ABC analysis classifies inventory by sales value. A-items generate 80% of revenue, B-items 15%, C-items 5%. This approach misses a critical factor: velocity. High-value products can be cash traps if they turn slowly.
A Lancashire tool distributor discovered this when reviewing their A-class inventory. Their top-selling pneumatic systems generated £800k annually but turned only 2.4 times per year. Meanwhile, consumable parts in C-class turned 18 times annually. The A-class items tied up £330k in working capital, the C-class items used £45k to generate equivalent cash flow.
Traditional ABC analysis would prioritise the pneumatic systems. Velocity-focused analysis reveals the consumables drive superior cash conversion. AI considers multiple factors traditional classification ignores: seasonality patterns, demand trends, supplier lead times, customer buying behaviour, and market conditions.
Dynamic Pricing Intelligence systems analyse 12 - 18 months of transaction data to identify velocity patterns that static classification misses. The algorithm tracks order frequency, purchase intervals, customer lifetime patterns, and seasonal fluctuations to predict which products will slow down before conventional reports catch it.
For distributors managing 5,000+ SKUs, this visibility prevents cash flow surprises that emerge from quarterly stock reviews.
Predicting Turn Rates Before Problems Emerge
Velocity decline follows predictable patterns. Order frequency drops first, then order quantities reduce, then customers switch suppliers or substitute products. AI detects these signals before they impact overall turn rates.
A Midlands industrial distributor implemented velocity intelligence after writeoffs hit £240k in one quarter. The system identified early warning signals: orders for hydraulic seals dropped from weekly to monthly, then monthly to quarterly. Purchase quantities fell from 50 units to 20, then 20 to 5. Traditional inventory reports showed healthy stock levels whilst customer behaviour was signalling obsolescence.
The algorithm flagged 180 SKUs showing early velocity decline patterns. Manual review confirmed 156 were at risk. Suppliers had introduced updated specifications, customers were switching to digital alternatives, or seasonal demand was ending earlier than historical patterns suggested.
Predictive Replenishment System capabilities track multiple predictive signals. Declining order frequency indicates demand shifts. Extending intervals between purchases suggest customer behaviour changes. Seasonal pattern disruption reveals market shifts. Customer account activity shows switching to alternative suppliers.
These signals appear 60 - 90 days before velocity decline shows in turn rate calculations. Early identification allows proactive management: promotional campaigns to clear stock whilst maintaining margins, adjustment of purchase quantities from suppliers, or coordination with sales teams to push specific products before they become dead stock.
Prevention beats cure. Identifying slow-moving stock before it accumulates prevents working capital lockup rather than managing it after the damage is done.
Automating Markdown Decisions for Cash Flow Optimisation
Manual markdown decisions balance two costs: holding costs against markdown losses. Hold too long and storage costs plus opportunity cost exceed recovery value. Mark down too early and margins disappear unnecessarily.
AI calculates optimal timing by modelling multiple scenarios. The system considers current velocity trends, storage costs, historical clearance rates at different markdown levels, seasonal effects, and alternative uses for the working capital.
A Yorkshire fashion distributor uses automated markdown cascades to optimise cash recovery. When a product's velocity drops below threshold, the system calculates markdown timing and pricing. Initial markdown at 15% aims to maintain margin whilst accelerating movement. If velocity doesn't improve within four weeks, secondary markdown at 35% prioritises cash recovery. Final clearance at 60% ensures stock clears before storage costs exceed recovery value.
"The system prevented £180k in writeoffs last year by catching slow-movers early and managing the clearance process. We recover 70 - 80% of cost instead of writing off completely."
- Operations Director, Fashion & Lifestyle Retail
The algorithm considers customer segments for targeted markdowns. Trade customers respond to quantity discounts. Retail customers respond to percentage reductions. End consumers respond to bundling offers. Automated segmentation ensures markdown strategies match customer buying behaviour for maximum effectiveness.
Returns Intelligence System integration prevents markdowns on products with high return rates, avoiding the double cost of reduced margins plus return handling.
Markdown automation removes emotion from clearance decisions. Teams hold slow-moving stock hoping velocity will recover. Algorithms make decisions based on data: if holding costs exceed recovery probability, clear the stock and redeploy the working capital.
Intelligent Stock Rotation and Dead Stock Prevention
Proactive velocity management prevents dead stock accumulation through intelligent rotation strategies. AI identifies products approaching velocity decline and triggers intervention before clearance becomes necessary.
Multi-location distributors benefit from automated stock balancing. A product slowing in one region accelerates in another. The system identifies imbalances and suggests transfers between locations, maintaining overall velocity whilst avoiding markdowns.
A Scottish builders merchant with seven branches implemented cross-location balancing after discovering £320k in duplicate slow-moving stock across sites. Concrete mixers popular in Glasgow sat unused in Inverness. Specialist roofing materials needed in Aberdeen accumulated in Dumfries. The algorithm identifies these mismatches and coordinates transfers, improving overall turn rates by 35% without additional purchasing.
Smart Fulfillment Engine integration optimises these transfers by considering transportation costs, storage capacity, and local demand patterns. Stock moves only when the velocity improvement exceeds transfer costs.
Promotional coordination accelerates slower-moving items before they become problems. The system identifies products with declining velocity and triggers marketing campaigns, sales incentives, or bundling opportunities. A paint distributor used this approach to clear 2,000 litres of specialist coatings by bundling with popular primer products, maintaining margins whilst accelerating turn rates.
Purchasing pattern adjustment prevents dead stock accumulation. When velocity trends decline, the system reduces reorder quantities and extends reorder intervals, matching supply to actual demand patterns rather than historical averages.
Prevention strategies require coordination across teams: purchasing, sales, marketing, and warehouse operations. AI provides the data foundation for these decisions but implementation requires workflow changes across departments.
Implementation Reality: What This Takes to Deploy
Velocity intelligence requires integration with ERP systems, point-of-sale data, and warehouse management systems. Most mid-market distributors need 8 - 12 weeks to implement effectively, not because the technology is complex, but because the workflow changes take time to embed.
Data requirements include 18 - 24 months of transaction history, current stock levels, supplier lead times, storage costs, and customer segmentation data. Clean product hierarchies and accurate cost data are essential for velocity calculations. Poor data quality undermines prediction accuracy.
Team adaptation presents the biggest challenge. Buying teams who've made decisions based on experience and intuition need to adapt to AI-driven recommendations. The transition requires training on interpreting velocity reports, understanding prediction confidence levels, and integrating algorithm outputs with market knowledge.
A Surrey electronics distributor spent four weeks on change management after discovering their buying team ignored AI recommendations that contradicted their market feel. The solution involved graduated implementation: algorithm recommendations for C-class items first, then expanding to B-class, finally covering A-class items once confidence was established.
Data Quality assessment typically reveals gaps that need addressing before velocity intelligence works effectively. Product categorisation, customer segmentation, and cost allocation often need cleaning before accurate predictions are possible.
Integration with existing workflows prevents disruption. Velocity alerts appear in existing purchasing systems rather than requiring separate applications. Markdown recommendations integrate with existing pricing approval processes. Stock transfer suggestions appear in warehouse management dashboards.
The technology component takes 2 - 3 weeks to deploy. Workflow adaptation and team training takes 6 - 8 weeks. Full benefits appear after 12 - 16 weeks as teams adapt everyday work processes to incorporate velocity intelligence.
Inventory velocity intelligence transforms stock management from a reactive discipline to proactive cash flow optimisation. Instead of discovering dead stock after quarterly reviews, distributors predict velocity decline before it impacts working capital.
The shift from traditional ABC analysis to velocity-focused classification reveals hidden cash traps: high-value, slow-moving items that consume working capital without generating returns. Early identification of velocity decline patterns allows intervention before clearance becomes necessary.
Automated markdown decisions remove emotion from clearance processes, optimising cash recovery whilst minimising storage costs. Intelligent stock rotation prevents dead stock accumulation through cross-location balancing and coordinated promotional campaigns.
For mid-market distributors carrying £2 - 10m in inventory, velocity intelligence typically improves working capital efficiency by 15 - 25% whilst reducing stockout risk. The combination of faster turns and lower clearance losses directly impacts cash flow and profitability.
Learn more about Predictive Replenishment System.
Common questions
How does AI improve inventory management beyond traditional methods like ABC analysis?
AI-driven inventory velocity goes beyond traditional ABC analysis by considering velocity, not just sales value. For example, a Lancashire tool distributor found that high-value pneumatic systems (A-class) turned only 2.4 times annually, tying up £330k, while low-value consumable parts (C-class) turned 18 times annually, using only £45k for equivalent cash flow. AI considers factors like seasonality, demand trends, and customer behavior to identify true cash flow drivers.
What specific signals does AI use to predict inventory velocity decline, and how far in advance can it do so?
AI detects early warning signals of velocity decline 60-90 days before traditional reports. These signals include order frequency dropping (e.g., weekly to monthly), order quantities reducing (e.g., 50 units to 5), extending intervals between purchases, seasonal pattern disruption, and customer account activity indicating switching to alternative suppliers.
Can AI help automate markdown decisions, and what factors does it consider for optimal timing?
Yes, AI automates markdown decisions by modeling multiple scenarios to optimize cash recovery. It considers current velocity trends, storage costs, historical clearance rates at different markdown levels, seasonal effects, and alternative uses for working capital. A Yorkshire fashion distributor used this to prevent £180k in write-offs by implementing markdown cascades based on velocity thresholds.
What is the financial impact of not using AI for inventory velocity management, based on the article's examples?
Without AI, distributors can have 15-25% dead or slow-moving stock, leading to significant capital lockup. For a £50m distributor, this means £7.5m tied up in non-performing inventory. A Midlands industrial distributor experienced £240k in write-offs in one quarter due to undetected velocity decline, highlighting the financial damage of reactive management.

Neil Boughton
Co-founder & Technical Director
Neil is a co-founder of WithPraxis. With more than 30 years in technical architecture and systems delivery, he sets the engineering direction for every WithPraxis platform and implementation. He specialises in the unglamorous but critical work, data pipelines, system integration, and making AI models perform reliably in production environments rather than just in demos.
Connect on LinkedInMore in this cluster
Continue exploring this topic
Platform capabilities and technical insights
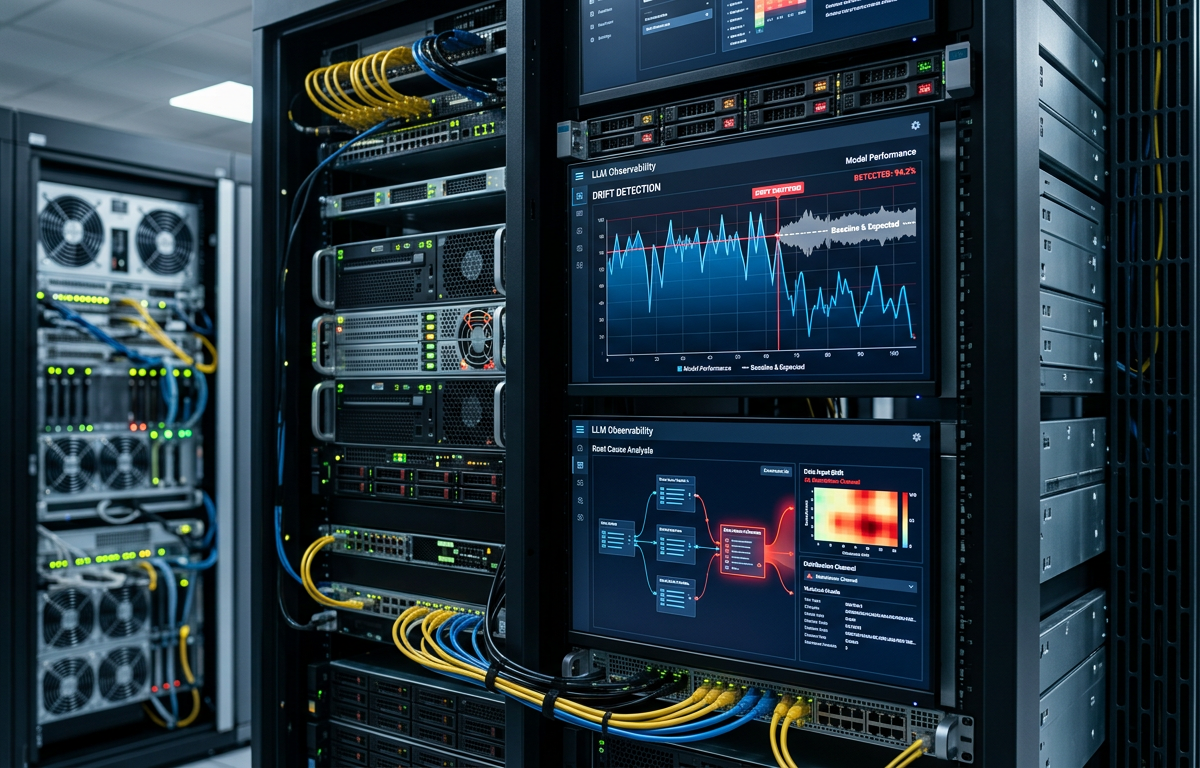
LLM Observability: Why Custom AI Models Need Different Monitoring
Custom AI models degrade silently in production. Most mid-market distributors discover this weeks after the damage begins—when pricing errors accumulate, inventory misallocates, or search results decay. Model drift is silent cost leakage that compounds over time.
Platform capabilities and technical insights
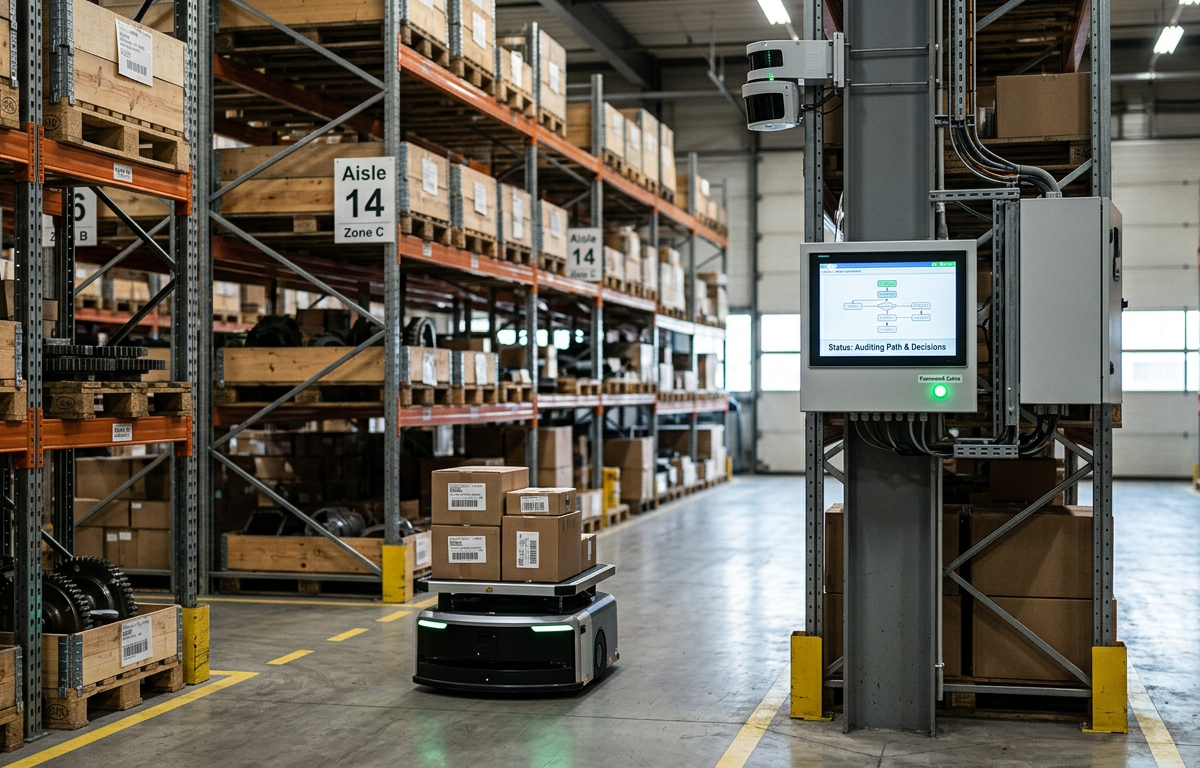
Controlled Automation: The Governance Framework Mid-Market Distributors Need Before Deployment
Autonomous agents can accelerate decisions and reduce costs in B2B commerce. But most mid-market distributors lack the governance frameworks to deploy them safely. Without audit trails, decision boundaries, escalation rules, and performance monitoring, autonomous systems become liabilities. This article maps the four control pillars required before autonomous everyday work goes into production - and the practical roadmap for implementing them without killing velocity.
Operational workflow improvement
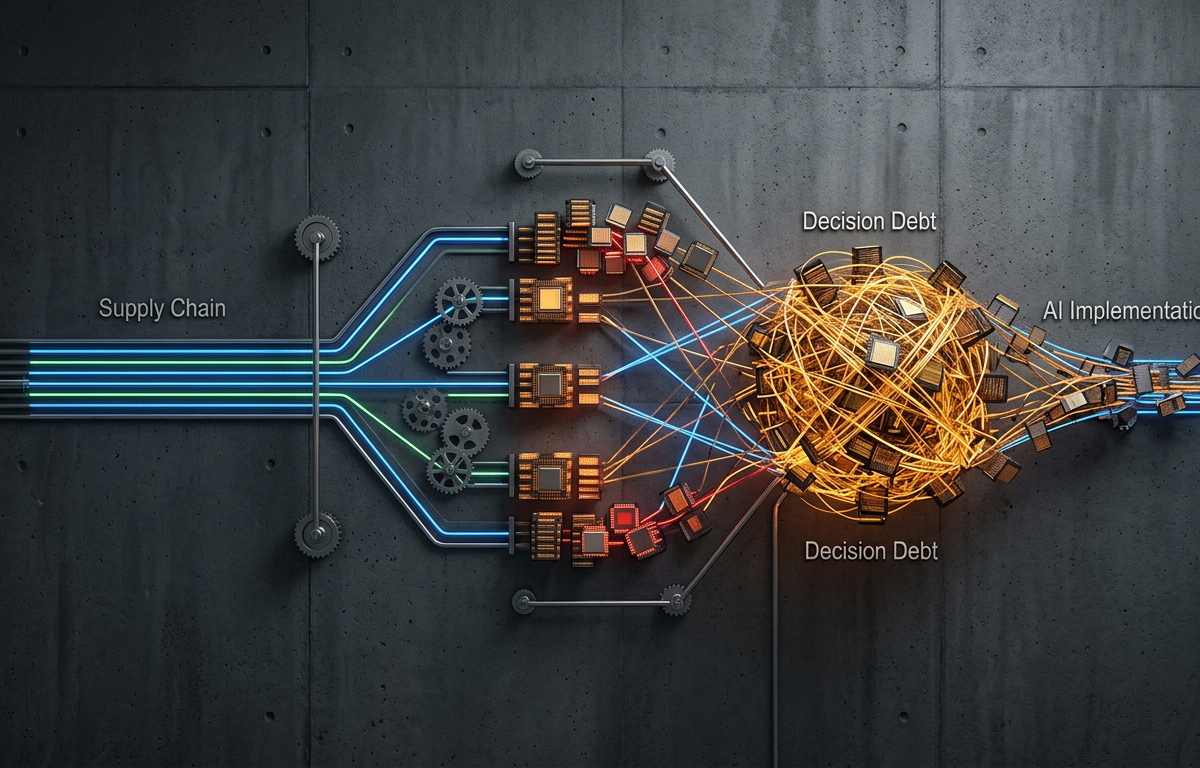
Supply Chain Workflow Debt: How Deferred Planning Choices Compound into AI Failure
Most mid-market distributors rush to AI deployment without auditing what they're actually deciding. A Nottinghamshire food wholesaler spent £85,000 on demand forecasting AI that sat dormant because buying decisions existed only in one person's head. The pre-implementation audit - decision inventory, assumption mapping, rule documentation - is the gate that determines whether AI works or sits unused.
Related Articles

Platform capabilities and technical insights
System Integration Challenges: When Legacy Meets Modern AI
A legacy ERP connects to a modern AI pricing platform. A field mapping breaks. Prices don't update. Nobody notices for 48 hours. By then, £15,000-£30,000 in margin has leaked. Silent failures are worse than loud ones because they compound. Real-time data observability makes these failures visible and resolvable before they cost money.
Platform capabilities and technical insights
LLM Observability: Why Custom AI Models Need Different Monitoring
Custom AI models degrade silently in production. Most mid-market distributors discover this weeks after the damage begins—when pricing errors accumulate, inventory misallocates, or search results decay. Model drift is silent cost leakage that compounds over time.
Was this article useful?