
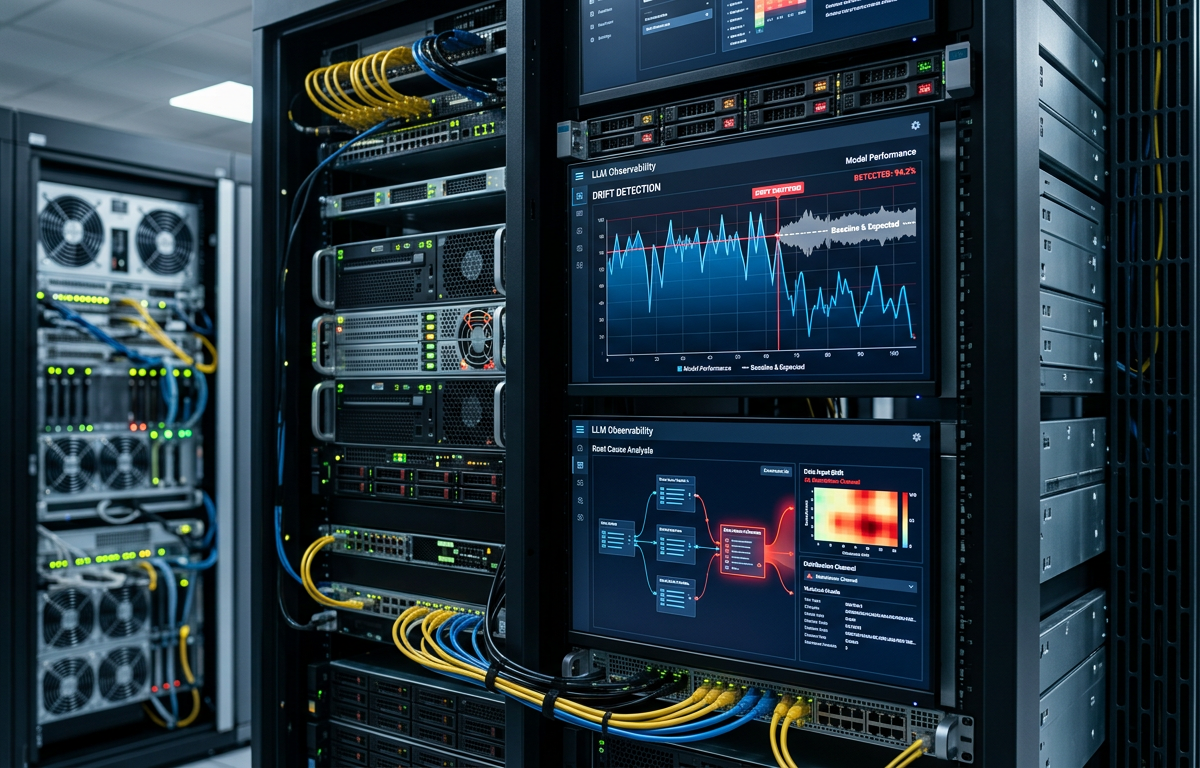
LLM Observability: Why Custom AI Models Need Different Monitoring
Custom AI models degrade silently in production. Most mid-market distributors discover this weeks after the damage begins—when pricing errors accumulate, inventory misallocates, or search results decay. Model drift is silent cost leakage that compounds over time.
Model Drift Detection: Catching AI Degradation Before It Costs You
A pricing model at a £55m builders merchant recommended 6% discounts on high-margin lines for three weeks before anyone noticed. The model hadn't failed. It had drifted. Input data shifted when a supplier changed their pack configurations, and the model interpreted the new SKU structure as low-margin commodity items. By the time the pricing team flagged it, £34,000 in margin had leaked.
Generic monitoring tools saw nothing wrong. Latency was normal. Error rates were zero. The model was technically performing exactly as designed. It was just making decisions based on a reality that no longer existed.
Custom AI models degrade silently in production. Most mid-market distributors discover this weeks after the damage begins, when pricing errors accumulate, inventory misallocates, or search results decay. This article covers what model drift is, why it happens in commerce operations, how to detect it before revenue leaks, and practical frameworks for root cause analysis and remediation.
What Is Model Drift and Why It Matters in Commerce Operations
Model drift occurs when a trained model's performance degrades because the data it encounters in production differs from the data it was trained on. Three types matter in commerce: data drift, concept drift, and label drift.
Data drift means the input distribution changes. A replenishment model trained on 2023 order patterns encounters 2024 patterns where customers order larger quantities less frequently. The model still runs, but its predictions become less accurate because the underlying behaviour has shifted.
Concept drift means the relationship between inputs and outputs changes. A pricing model learns that competitor price movements correlate with demand elasticity. Then a competitor exits the market. The model continues using competitor pricing as a signal, but the relationship no longer holds.
Label drift means the ground truth changes. A search model trained on 2023 click behaviour encounters 2024 users who search differently, using technical specifications instead of product names. What constituted a "good result" in training no longer matches what users want.
A concrete example: a pricing model trained on January-to-March supplier cost data becomes stale when a major supplier increases prices by 8% in April. The model continues recommending margins based on outdated cost assumptions. Across our implementations, clients typically discover drift 4-8 weeks after it begins, by which point the operational damage has compounded across thousands of transactions.
The Cost of Silent Model Failure: Revenue Leakage You Can't See
A dynamic pricing model drifts and starts recommending prices 4-7% below optimal margin. The business runs this model across 6,000 SKUs. Over three months, margin erodes by £55,000-£90,000 before the finance team notices during quarterly review. By then, customer expectations have reset to the lower prices.
A replenishment model drifts and over-orders slow-moving stock across 40 product lines. The model was trained on pre-pandemic demand patterns and hasn't adjusted for the shift to smaller, more frequent orders. Result: £140,000 tied up in excess inventory that won't turn for 6-9 months.
A search relevance model drifts and product discovery drops 18% in the trade catalogue. Contractors searching for "M10 zinc-plated hex bolts" get decorative screws in the top five results. Conversion falls 3% across the category. The commercial team assumes it's a market softness issue and adjusts their buying forecast downward, compounding the problem.
Most mid-market distributors don't have monitoring in place, so drift goes undetected for 6-14 weeks. Of the businesses we assess for AI Readiness, the average score is 5.6 out of 10, and monitoring and governance consistently score lowest. Without drift detection, you're running AI models blind. The models continue making decisions. You just don't know if those decisions are still valid.
Building a Drift Detection Framework: What to Monitor
Drift detection requires four layers of monitoring: input, output, performance, and business metrics.
Input monitoring tracks statistical properties of incoming data. For a pricing model, monitor the distribution of supplier costs, competitor prices, and order volumes. Calculate mean, variance, and distribution shape weekly. If the mean supplier cost shifts by more than 5% or the variance doubles, investigate. For a replenishment model, monitor order frequency, order size, and lead times. A shift in any of these signals potential drift.
Output monitoring tracks the model's prediction distribution and decision frequency. For a pricing model, monitor the average recommended price, the variance in recommendations, and the frequency of discount suggestions. If average recommended price drops by more than 3% without a corresponding cost reduction, that's drift. For a search model, monitor the diversity of results returned and the frequency with which low-inventory items appear in top results.
Performance monitoring tracks actual outcomes against predictions, but only if ground truth is available. For a replenishment model, compare predicted demand to actual demand weekly. If forecast accuracy drops below 75% for more than two consecutive weeks, trigger investigation. For a pricing model, compare recommended margin to achieved margin.
Business metric monitoring tracks operational KPIs the model influences. For pricing: gross margin percentage, discount frequency, win rate on quotes. For replenishment: stock-out rate, excess inventory value, inventory turn. For search: click-through rate, conversion by category, bounce rate on product pages.
Establish baselines during the first 2-4 weeks of production. Set alert thresholds based on operational tolerance. A 2% margin drop is acceptable variance. A 5% drop is drift. A 10% drop is a failure requiring immediate intervention. Most distributors can implement basic drift detection in 4-6 weeks using existing analytics infrastructure and open-source statistical libraries.
Root Cause Analysis: Why Models Drift and How to Fix It
Models drift for four common reasons in commerce operations.
Data quality degradation: upstream systems change, introducing missing values, incorrect labels, or schema shifts. A client's pricing model drifted when their ERP migrated to a new version and started populating the "cost" field differently, including freight in some records but not others. The model interpreted this as cost volatility and adjusted pricing logic accordingly.
External shocks: market disruption, supplier exits, regulatory changes, or demand pattern shifts. A replenishment model trained on 2019 data failed spectacularly in 2020 when demand patterns shifted overnight. The model had no concept of pandemic-driven stockpiling behaviour.
Feedback loops: the model's predictions influence future data. A pricing model recommends aggressive discounts to clear slow-moving stock. Customers learn to wait for discounts. Demand patterns shift toward discount-seeking behaviour. The model retrains on this new data and becomes even more discount-aggressive. The loop accelerates.
Seasonal or cyclical patterns: a model trained on summer demand fails in winter. A fashion distributor's markdown model trained on spring/summer clearance patterns recommended aggressive discounts on autumn/winter lines in October, three months too early. The model had learned that clearance velocity correlated with discount depth but hadn't learned that timing mattered.
Remediation follows a five-step framework. First, pause the model or revert to the previous version if drift is severe. Prioritise stopping the damage. Second, investigate root cause using data profiling, statistical comparison of training vs production data, and domain expert input. Third, retrain on recent data if the drift reflects a legitimate distribution shift. Fourth, adjust alert thresholds if the drift is expected. For example, seasonal models need seasonal thresholds. Fifth, document the incident, update monitoring rules, and add the scenario to your drift playbook.
A concrete example: a client's pricing model drifted when a major supplier restructured their cost model, moving from per-unit pricing to tiered volume pricing. The fix required retraining on six weeks of recent transaction data and adjusting the model's supplier-cost sensitivity parameters. Root cause analysis took four days. Retraining took two days. Validation against recent transactions took three days. Total remediation time: nine days from detection to redeployment.
Governance and Alerting: Making Drift Detection Operational
Drift detection only works if alerts reach the right people and trigger action.
Define ownership: every model needs a business owner, usually the person responsible for the decision the model supports. The pricing manager owns the pricing model. The inventory planner owns the replenishment model. The ecommerce manager owns the search model. Ownership means accountability for monitoring, investigation, and remediation decisions.
Define alert severity: warning, critical, emergency. A warning means performance is degrading but still within acceptable bounds. Investigate within 48 hours. Critical means performance has crossed a threshold. Investigate within 24 hours. Emergency means the model is causing active operational damage. Pause immediately and investigate within 4 hours.
Define response SLAs: critical alerts require investigation within 24 hours and root cause identification within 72 hours. Emergency alerts require immediate model pause and root cause identification within 48 hours. Warnings require investigation within one week.
Establish a review cadence: weekly for high-impact models (pricing, replenishment, fraud detection), monthly for lower-impact models (search, recommendations). Review sessions should cover alert history, performance trends, and upcoming risks (known data changes, seasonal shifts, supplier transitions).
Document remediation: every drift incident should be logged with root cause, remediation steps, timeline, and outcome. This builds institutional knowledge and improves future response times.
A practical example: a pricing model alert triggers when achieved margin drops more than 2% below recommended margin for three consecutive days. The pricing manager receives the alert. If the cause is a known market shift (competitor launched a promotion), they acknowledge the alert and adjust thresholds temporarily. If the cause is unknown, they escalate to the data team for root cause analysis.
Across client engagements, organisations achieve 30-45% improvement in key operational metrics within six months of deploying Performance Monitoring and Model Maintenance frameworks, but only when monitoring and governance are in place from day one. Without governance, alerts become noise. Teams learn to ignore them. Models drift silently until the damage is too large to miss.
Preventing Revenue Leakage Through Early Detection
Model drift is silent cost leakage that compounds over weeks and months. A pricing model that drifts by 3% erodes tens of thousands in margin before anyone notices. A replenishment model that drifts ties up hundreds of thousands in excess stock. A search model that drifts costs you conversion points and customer trust.
Early detection prevents revenue leakage. A proper drift detection framework requires four components: monitoring (input, output, performance, business metrics), root cause analysis capability (data profiling, domain expertise, statistical comparison), remediation playbooks (pause, investigate, retrain, validate, document), and governance (ownership, alert severity, response SLAs, review cadence).
Implementation typically takes 4-8 weeks for a single model, 8-12 weeks for a portfolio of models. The investment is small relative to the cost of undetected drift. If you're running custom AI models in production without drift detection, you're flying blind.
Learn more about Performance Monitoring and Model Maintenance.
Common questions
How does data drift specifically impact inventory replenishment models in a distribution environment?
Data drift occurs when the statistical distribution of input data, such as customer order patterns, shifts away from the historical data used during model training. In a distribution context, this typically manifests as a model encountering larger, less frequent orders in 2024 while still expecting the smaller, more frequent patterns of 2023. This mismatch leads to inaccurate predictions that can result in over-ordering slow-moving stock or failing to meet actual demand.
What are the primary financial risks of undetected model drift in dynamic pricing systems?
The primary risk is silent margin erosion where the model recommends prices below optimal levels, often by 4-7%, across thousands of SKUs. For a mid-market distributor, this can result in £55,000 to £90,000 in leaked margin over a single quarter before the issue is identified during financial reviews. Once these lower prices are established, businesses face the additional challenge of resetting customer expectations to original margin levels.
Which operational metrics should a commerce leader monitor to identify search relevance decay?
Leaders should monitor the click-through rate, conversion by category, and the bounce rate on product pages to detect search model drift. Specific technical indicators include a drop in product discovery within trade catalogues or a decrease in the diversity of results returned for technical specifications. A decline in conversion, such as a 3% drop across a category, often signals that the model is no longer surfacing the results users expect.
What thresholds should be used when establishing an automated drift detection framework?
Thresholds must be set based on operational tolerance, using the first 2-4 weeks of production data to establish a baseline. For a pricing model, a shift in mean supplier cost of more than 5% or a doubling of variance should trigger an investigation. While a 2% margin drop might be classified as acceptable variance, a 5% drop is defined as drift and a 10% drop constitutes a total model failure.
Tags
Themes

Ricki Larkin
AI Solutions Specialist
Ricki focuses on applying AI within commerce environments, helping translate emerging capabilities into practical use cases. He works across data, automation, and decision-support systems, supporting businesses as they adopt AI in a structured and governed way.
Connect on LinkedInMore in this cluster
Continue exploring this topic
Platform capabilities and technical insights
Controlled Automation: The Governance Framework Mid-Market Distributors Need Before Deployment
Autonomous agents can accelerate decisions and reduce costs in B2B commerce. But most mid-market distributors lack the governance frameworks to deploy them safely. Without audit trails, decision boundaries, escalation rules, and performance monitoring, autonomous systems become liabilities. This article maps the four control pillars required before autonomous everyday work goes into production - and the practical roadmap for implementing them without killing velocity.
Operational workflow improvement
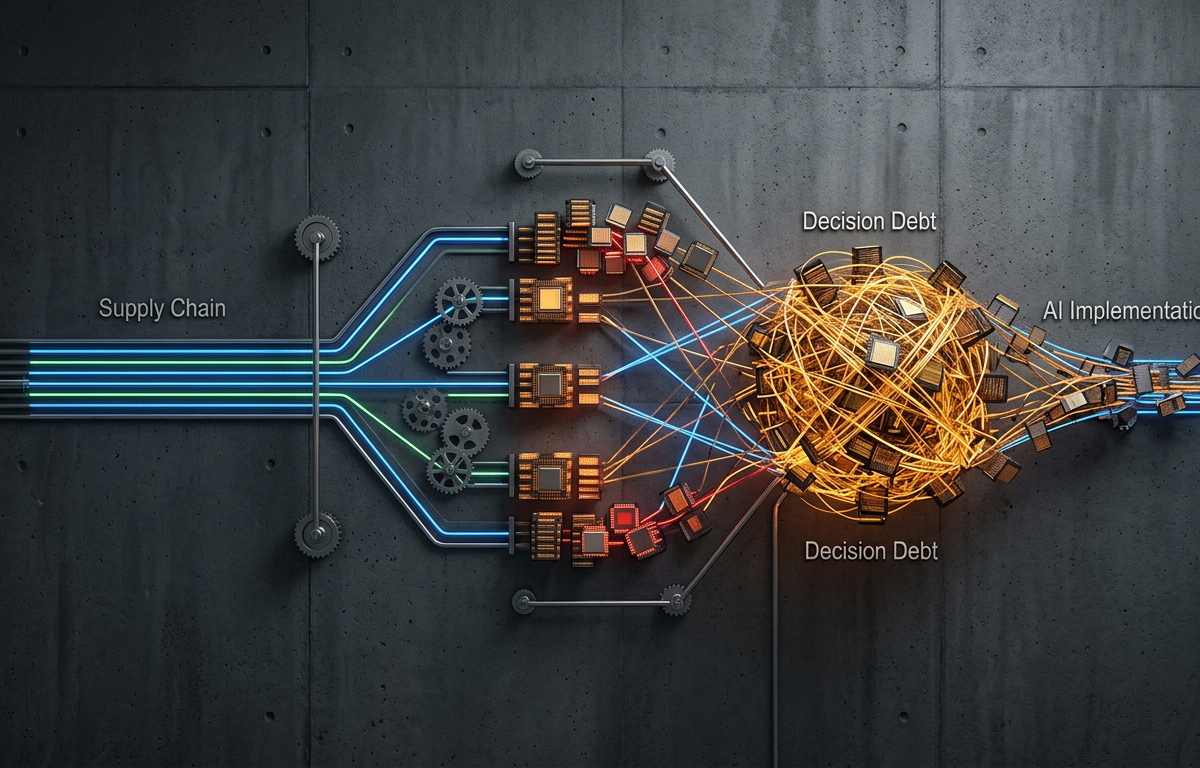
Supply Chain Workflow Debt: How Deferred Planning Choices Compound into AI Failure
Most mid-market distributors rush to AI deployment without auditing what they're actually deciding. A Nottinghamshire food wholesaler spent £85,000 on demand forecasting AI that sat dormant because buying decisions existed only in one person's head. The pre-implementation audit - decision inventory, assumption mapping, rule documentation - is the gate that determines whether AI works or sits unused.

Platform capabilities and technical insights
Build vs Buy vs Partner: The AI Vendor Selection Framework for Mid-Market Distributors
Mid-market distributors face three paths when deploying AI: pre-built vendor models, custom development, or third-party APIs. Most lack a clear framework to evaluate them. The wrong choice delays implementation by 6-12 months and wastes £50,000-£200,000. This decision matrix maps implementation timeline, cost structure, and risk profile for each approach. Pre-built models deploy in 8-12 weeks at lower cost but limited customisation. Custom development takes 16-24 weeks with full control and competitive advantage. Third-party APIs offer middle ground at moderate cost and configuration flexibility. The right choice depends on data maturity, technical capacity, and competitive urgency. A distributor with clean data and a 6-month runway can pursue custom development. A distributor with fragmented systems and a 10-week deadline cannot. Four questions determine the viable path: data quality, timeline urgency, competitive differentiation, and internal technical capacity.
Related Articles

Platform capabilities and technical insights
System Integration Challenges: When Legacy Meets Modern AI
A legacy ERP connects to a modern AI pricing platform. A field mapping breaks. Prices don't update. Nobody notices for 48 hours. By then, £15,000-£30,000 in margin has leaked. Silent failures are worse than loud ones because they compound. Real-time data observability makes these failures visible and resolvable before they cost money.

Platform capabilities and technical insights
Event-Driven Architecture: Real-Time Commerce Operations at Scale
A West Midlands foodservice distributor runs seven systems: SAP for ERP, Shopify Plus for commerce, Manhattan for warehousing, Salesforce for CRM, Xero for accounting, Akeneo for product data, and a legacy routing tool built in-house. None of them talk to each other in real time. Pricing updates take three days. Inventory visibility lags 24 hours behind actual stock. The operations director spends Monday mornings reconciling conflicts created by systems working from different versions of the truth. This is the middleware bottleneck. Mid-market B2B distributors have invested in best-of-breed systems but lack the integration layer to connect them. The B2B middleware market reached £14.1 billion in 2025, growing at 12.23% annually (MarketsandMarkets, 2024). That growth reflects a painful reality: buying good systems is easy, making them work together is not. Event-driven architecture promises to solve this. Order placed, inventory updated, fulfilment triggered, customer notified—all in real time. But most mid-market stacks lack the middleware to orchestrate that sequence. Without it, teams fall back to manual processes and the operational friction compounds.
Was this article useful?