

Market Sensing Intelligence: Reading Weak Signals Before Competitors
Quarterly forecasts miss demand shifts that happen in days. Demand sensing uses real-time weak signals—POS data, supply disruptions, social trends—to detect changes 24-72 hours before they appear in historical patterns. For mid-market distributors managing volatile categories, this decision speed translates directly into margin capture and stockout reduction.
Introduction
A foodservice distributor in the East Midlands runs monthly demand forecasts. In week one of March 2024, a supplier quietly extended lead times on eggs from five days to eight. The forecast model, trained on historical order patterns, wouldn't register the change until week four when the next cycle ran. By then, avian flu outbreaks had hit regional farms and the distributor faced stockouts worth £18,000 in lost margin.
Traditional demand forecasting operates in the rear-view mirror. It assumes tomorrow looks like yesterday, which works until the environment shifts. When demand changes faster than your forecast cycle, you're not planning—you're reacting.
Demand sensing offers a different approach. Instead of waiting for demand shifts to appear in historical sales data, it detects weak signals—POS data, supply chain disruptions, social trends, weather patterns—that precede those shifts by hours or days. This article covers what demand sensing actually is, how it differs operationally from traditional forecasting, what infrastructure it requires, and when the investment delivers measurable return.
The Forecast Lag Problem: Why Historical Data Arrives Too Late
Traditional demand forecasting relies on historical sales data to predict future demand. The model looks at last quarter's orders, applies seasonal adjustments, and generates a procurement plan. This works well in stable environments. It fails when demand shifts faster than your forecast cycle.
Most mid-market distributors run monthly or quarterly forecasts. A demand shift detected in week one doesn't influence procurement decisions until week four to six. A construction supply distributor in the South East saw residential building permits spike 22% in early 2024. The weak signal was visible in public permit filings within days. Their quarterly forecast didn't pick it up until the next cycle ran eight weeks later. By then, competitors had already adjusted inventory and captured the margin window.
The problem isn't the model's accuracy. It's the latency. Historical data is always backward-looking. By the time a demand shift shows up in sales data, it's already happened.
A foodservice distributor managing commodity-linked SKUs faces this daily. Egg prices swing 15-30% based on supply shocks. By the time a forecast updates to reflect rising demand, suppliers have allocated capacity and margin opportunity has passed. The distributor either pays premium prices or faces stockouts. Both outcomes cost money.
What Demand Sensing Actually Is: Real-Time Weak Signals
Demand sensing detects demand shifts using real-time data sources that precede historical sales patterns. Instead of waiting for last month's orders to populate a forecast model, it monitors signals that predict demand changes 24-72 hours in advance.
These signals include point-of-sale data from retail customers (hours old, not weeks), supply chain disruption alerts (supplier lead time changes, port delays, freight cost spikes), social media mentions and search volume trends, weather data affecting seasonal demand, and regulatory filings like building permits or planning applications. Individually, these signals are noisy. A single supplier email about lead times might mean nothing. Collectively, they form a pattern.
A fashion distributor in the North West monitors social media mentions of specific product categories. When mentions of a trend spike 40% over three days, the distributor adjusts inventory before the trend appears in sales data. This gives them a one to two week head start over competitors relying on monthly sales reports. By the time the sales data confirms the trend, they've already captured margin and avoided stockouts.
The concept of weak signals matters here. These aren't definitive predictions. They're early indicators that something is changing. A 10% increase in search volume for "outdoor heaters" in September might signal early demand for winter products. A supplier's lead time extending from five days to seven might indicate capacity constraints. A competitor repricing a category might suggest they've detected a demand shift you haven't.
Demand sensing aggregates these signals, weights them based on historical reliability, and flags when multiple signals converge. The output isn't a perfect forecast. It's a faster one.
Demand Sensing vs Demand Forecasting: The Operational Difference
Demand forecasting uses historical data, runs on monthly or quarterly cycles, and produces reactive procurement plans. Demand sensing uses real-time signals, updates continuously, and enables anticipatory decisions. The operational difference is decision speed.
A distributor using traditional forecasting detects a demand shift when it appears in sales data, waits for the next forecast cycle to run, updates the procurement plan, and places orders. This takes four to six weeks. A distributor using demand sensing detects weak signals indicating a demand shift, updates inventory priorities within 24-48 hours, and adjusts procurement before the shift appears in sales data.
Mid-market distributors using demand sensing report 25-40% faster inventory adjustment cycles and 3-8% reduction in stockouts and overstock (WithPraxis client data, 2024). The competitive advantage isn't perfect prediction. It's moving first. A distributor that adjusts inventory 48 hours faster than competitors captures margin and customer satisfaction before the market reacts.
Consider two building materials distributors managing the same product category. Both see a demand spike driven by a housing development announcement. The first uses quarterly forecasts and reacts in week four when the sales data updates. The second uses demand sensing, detects the spike through building permit filings and contractor order patterns, and adjusts inventory within 48 hours. The second distributor captures three weeks of margin the first misses—either through stockouts or emergency orders at premium prices.
Demand sensing doesn't replace forecasting. It accelerates it. The forecast model still runs, but it ingests real-time signals alongside historical data. This produces procurement plans that reflect what's changing now, not what changed last quarter.
Building Demand Sensing: Data Infrastructure and Real-Time Integration
Demand sensing requires real-time data pipelines connecting POS systems, supply chain data, external signals, and inventory systems. Most mid-market distributors have data spread across five or more systems with no real-time integration.
Your ERP holds historical order data. Your WMS tracks current inventory. Your ecommerce platform captures customer behaviour. Your supplier portal shows lead times and availability. Your CRM logs customer interactions. Each system updates on different schedules—some real-time, some overnight batch processes, some weekly exports. Unifying these into a real-time signal stream that feeds a demand sensing model takes 8-12 weeks of integration work.
Across our implementations, organisations score an average of 5.6 out of 10 on AI readiness assessments (WithPraxis client data, 2024). Most lack the data infrastructure for demand sensing. They have the data sources—they just can't connect them fast enough to act on weak signals.
Demand sensing isn't a software purchase. It's a data architecture decision. You need a data mesh or integration platform that can ingest data from multiple sources, normalise formats, resolve conflicts, and deliver a unified view in under five seconds. Without this foundation, you're still working from yesterday's numbers.
A Midlands distributor managing foodservice and construction supply ran into this in 2023. They had POS data from retail customers, supplier alerts via email, and building permit data from local councils. None of it connected. Building the integration layer took ten weeks. Once live, they detected demand shifts 48-72 hours faster than before, reducing stockouts by 18% in the first quarter.
The barrier to demand sensing isn't the algorithm. It's the plumbing. If your data infrastructure can't deliver real-time signals, your demand sensing model is just a faster way to analyse old data. Learn more about System Integration and Data Quality services that support real-time data pipelines.
When Demand Sensing Wins: Volatility, Seasonality, and Supply Disruption
Demand sensing delivers the most value in volatile, seasonal, or disruption-prone categories. Foodservice distribution faces commodity price swings and short shelf lives. Fashion retail deals with trend-driven demand that shifts weekly. Construction supply responds to permit-driven spikes and weather delays. Industrial distribution navigates supply chain disruptions and long lead times.
A foodservice distributor in Yorkshire used demand sensing to monitor supplier lead times, commodity price indices, and customer order frequency. In early 2024, they detected a 15% demand spike for dairy products 48 hours before it appeared in historical sales data. They placed procurement orders before supplier allocation limits kicked in, capturing full margin while competitors faced stockouts or paid premium prices.
The ROI calculation is straightforward. If demand sensing reduces stockouts by 5%, cuts overstock by 8%, and accelerates inventory turns by 10%, the margin improvement is 3-8% for most distributors. For a £50m distributor, that's £1.5m-£4m in annual margin recovery.
Organisations in stable, predictable categories see less return. An office supplies distributor with flat demand and reliable suppliers won't gain much from real-time weak signals. Their quarterly forecast already works. But a construction supply distributor monitoring building permit filings gains a two-week head start on demand spikes, adjusting inventory before competitors react.
A fashion distributor in the South East tracks social media mentions, search volume, and influencer activity. When a product category sees a 30% spike in mentions over three days, they adjust inventory within 24 hours. By the time the trend appears in sales data, they've already captured margin and avoided markdowns. Competitors relying on monthly sales reports miss the window entirely.
Demand sensing isn't universally valuable. It wins where demand volatility, supply disruption risk, or seasonal swings make decision speed material.
Conclusion
Demand sensing is not about perfect prediction. It's about decision speed. Distributors that detect demand shifts 24-72 hours earlier than competitors adjust inventory faster, capture margin, and reduce stockouts.
The barrier isn't the algorithm. It's the data infrastructure. Building real-time pipelines that connect POS systems, supply chain data, and external signals takes 8-12 weeks of integration work. But once live, demand sensing enables procurement decisions based on leading indicators, not lagging ones.
Learn more about Predictive Replenishment System.
Common questions
How does demand sensing reduce the financial impact of supply chain disruptions compared to traditional forecasting?
Demand sensing identifies lead time changes and supply shocks in real-time rather than waiting for the next monthly forecast cycle to process historical sales. This allows distributors to adjust procurement within 24 to 48 hours, preventing margin loss from stockouts or emergency premium pricing. In the foodservice sector, this rapid response can protect thousands of pounds in margin during volatile commodity shifts.
What specific data sources are required to implement a demand sensing strategy?
Implementation requires integrating real-time 'weak signals' such as point-of-sale data, supplier lead time alerts, weather patterns, and regulatory filings like building permits. These sources provide immediate indicators of market shifts that precede historical order patterns. By aggregating these noisy signals, the system identifies converging trends days or weeks before they manifest in standard ERP reports.
What are the measurable operational benefits for a mid-market distributor moving from forecasting to sensing?
Distributors typically see inventory adjustment cycles accelerate by 25% to 40% when adopting demand sensing. This increased agility leads to a 3% to 8% reduction in both stockouts and overstock levels according to 2024 performance data. The primary advantage is the ability to capture margin windows and maintain customer service levels before competitors can react to the same market changes.
How does the everyday work process change for a procurement leader using demand sensing?
The procurement workflow shifts from a reactive monthly cycle based on past performance to an anticipatory model driven by continuous data updates. Instead of waiting for quarterly sales reviews, leaders adjust inventory priorities and placement within hours of detecting a signal. This allows the organisation to secure supplier capacity and optimise stock levels ahead of the actual demand spike.
Tags
Themes

Ian Gordon
Business Development Director
Ian leads business development at WithPraxis, working closely with clients to define and shape complex commerce programmes. With extensive experience across digital transformation and platform delivery, he focuses on connecting business goals with practical, scalable solutions.
Connect on LinkedInMore in this cluster
Continue exploring this topic

Commerce operations insights and applications
Agentic AI Observability: Detecting When Your Autonomous Systems Are Operating on Bad Data
Agentic systems fail quietly. A pricing agent drifts 2% below target margin over eight weeks, processing 4,200 decisions before anyone notices. Margin leakage: £87,000. The agent didn't crash or throw errors—it just made slightly wrong decisions, consistently, for two months. Gartner predicts 40% of agentic AI projects will be cancelled by 2027, primarily due to silent degradation that compounds into operational disasters.
Operational workflow improvement
Why Fortune 500 Supply Chain AI Fails at Mid-Market: The Complexity Mismatch Problem
Fifty-seven percent of supply chain leaders cite data quality as the primary barrier to AI adoption. Not model accuracy. Not cost. Data quality. Most mid-market distributors have data spread across five to seven systems with no single source of truth. You cannot train an AI model on conflicting data. The unglamorous work of master data management, integration, and governance must come first.
Operational workflow improvement
Inventory Decisions Under Uncertainty: When AI Forecasts Conflict With Safety Stock Rules
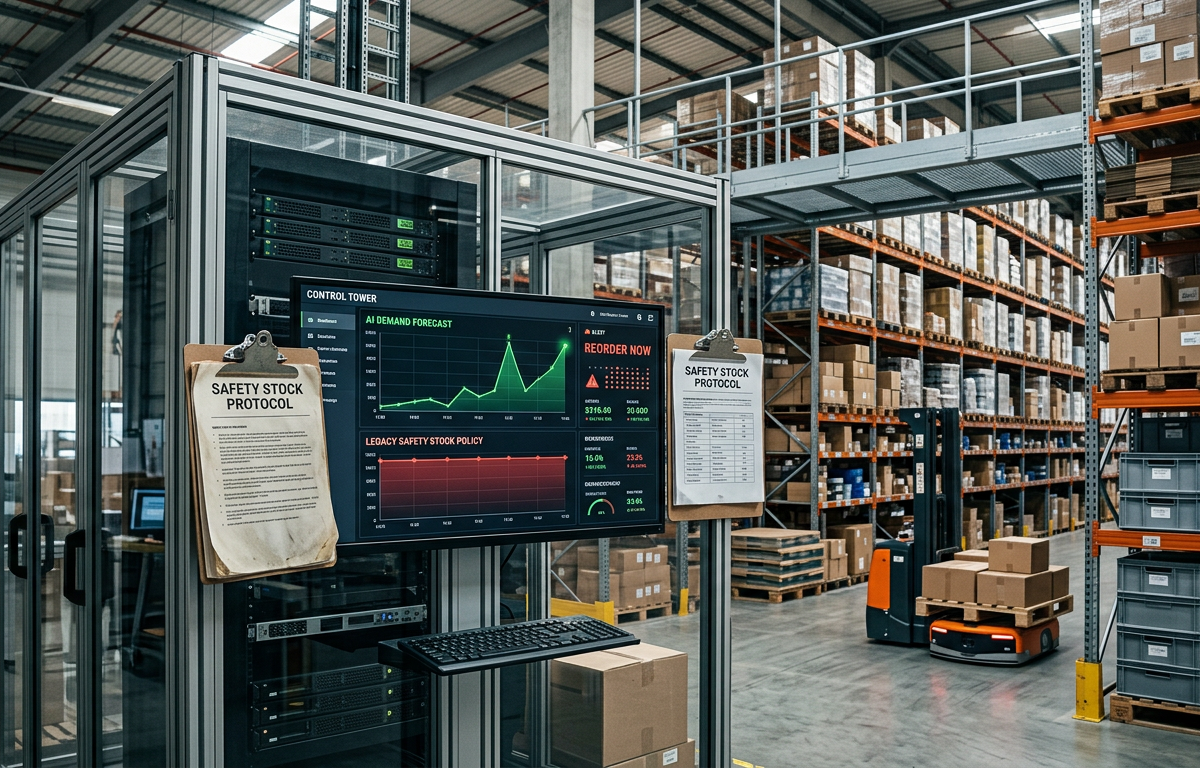
Deploying demand sensing AI without retiring legacy safety stock policies creates a hidden cost: dual everyday work. Inventory planners second-guess AI recommendations, override autonomous reorder points, and maintain manual guardrails 'just in case.' This article quantifies the cost of running both systems, explains why most deployments fail at the governance layer, and outlines the workflow clarity required to let one system own inventory decisions.
Related Articles
Platform capabilities and technical insights
System Integration Challenges: When Legacy Meets Modern AI
A legacy ERP connects to a modern AI pricing platform. A field mapping breaks. Prices don't update. Nobody notices for 48 hours. By then, £15,000-£30,000 in margin has leaked. Silent failures are worse than loud ones because they compound. Real-time data observability makes these failures visible and resolvable before they cost money.
Platform capabilities and technical insights
LLM Observability: Why Custom AI Models Need Different Monitoring
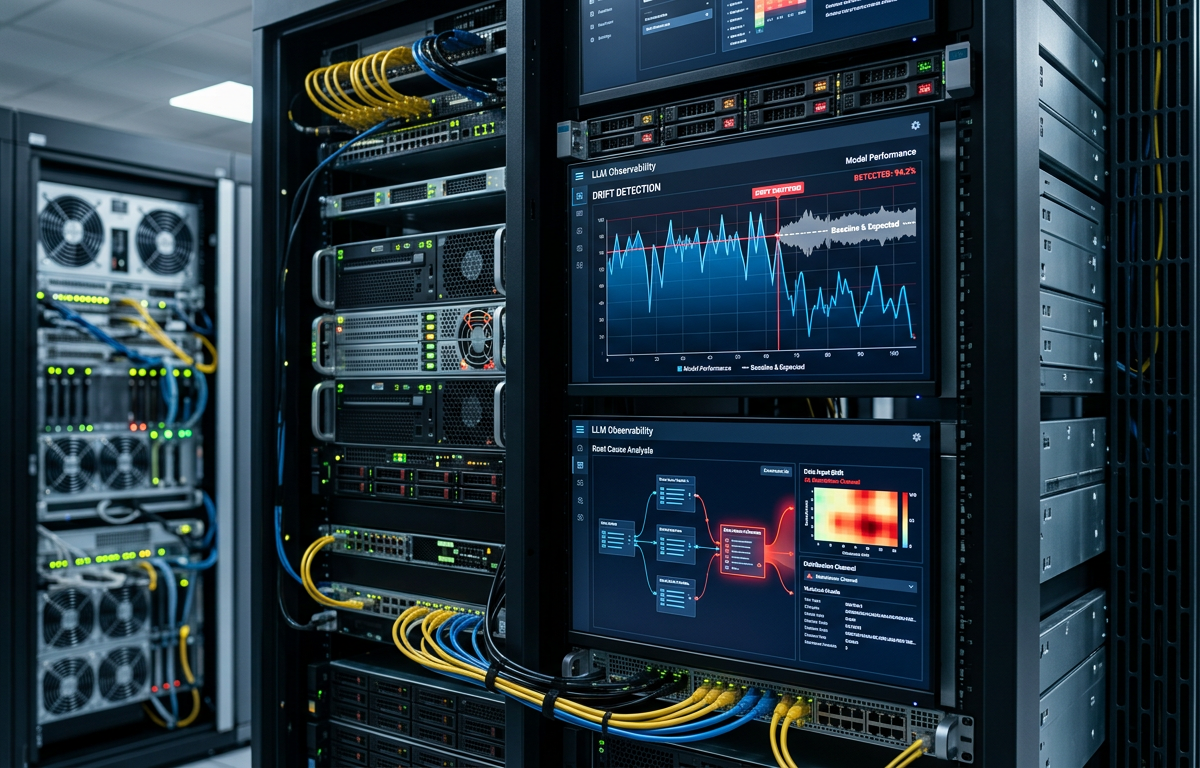
Custom AI models degrade silently in production. Most mid-market distributors discover this weeks after the damage begins—when pricing errors accumulate, inventory misallocates, or search results decay. Model drift is silent cost leakage that compounds over time.
Was this article useful?